SCERT AP 7th Class Maths Solutions Pdf Chapter 6 Data Handling Ex 6.4 Textbook Exercise Questions and Answers.
AP State Syllabus 7th Class Maths Solutions 6th Lesson Data Handling Ex 6.4
Question 1.
In the adjacent Double bar graph, the number of students of a class is shown according to the academic year.
Answer the following questions on the basis of this Double bar graph,
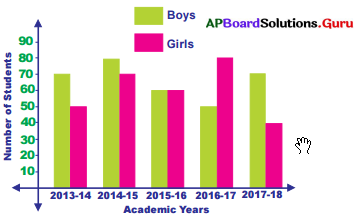
(i) In which academic year, number of girls wrere more than number of boys in the school ?
Answer:
In the year 2016-17 number of girls were more than number of boys in the school.
![]()
(ii) In which academic year, number of both girls and boys in the school were equal ?
Answer:
In the year 2015-16 number of bot.fi’ girls and boys in the school were equal.
(iii) What was the total number of students in the school in the academic year 2013-14 ?
Answer:
In the academic year 2013-14
Number of boys = 70
Number of girls = 50 .

Total = 120
Total number of students in the school in the academic year 2013-14 is 120.
Question 2.
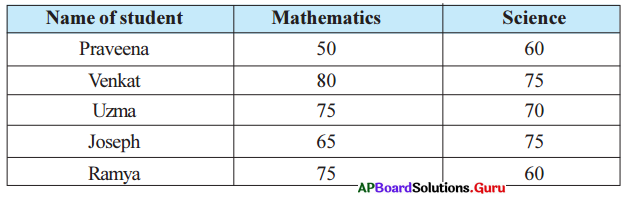
The marks in Mathematics and Science of five students of class 7 are given in the table. Exhibit these by the vertical double bar graph by given information.
Answer:
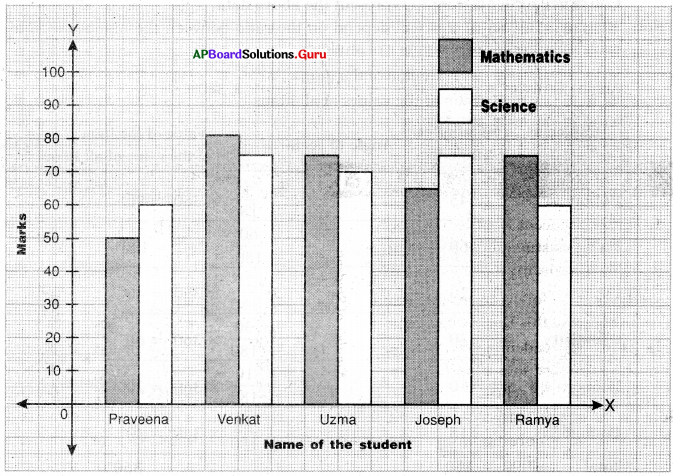
![]()
Question 3.
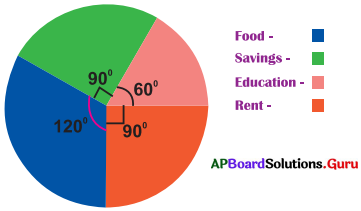
The adjacent Pie chart gives the expenditure on various items during a month for a family. In the figure angles made by each sector at the center are given then answer the following : i) If the expenditure on rent is ?3000, then how much amount they saved ?
Answer:
Angle of sector on Rent = 90°
Angle of sector on Savings = 90°
Angle of sectors are equal. So, their amounts are also equal. Expenditure on rent is ₹3000.
(ii) On which item the expenditure is minimum ?
Answer:
Smallest angle of sector on Education is the item of expenditure is minimum.
So, expenditure on education is minimum.
(iii) On which item the expenditure is maximum ?
Answer:
Largest angle of sector on Food is the item of expenditure is maximum.
So, expenditure on food is maximum.
![]()
Question 4.
The following data shows the number of students opting different subjects in college.
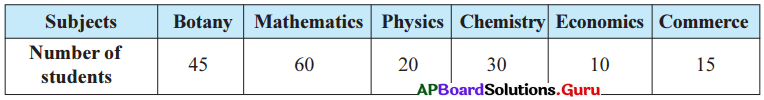
Construct a Pie diagram to represent the above data.
Answer:
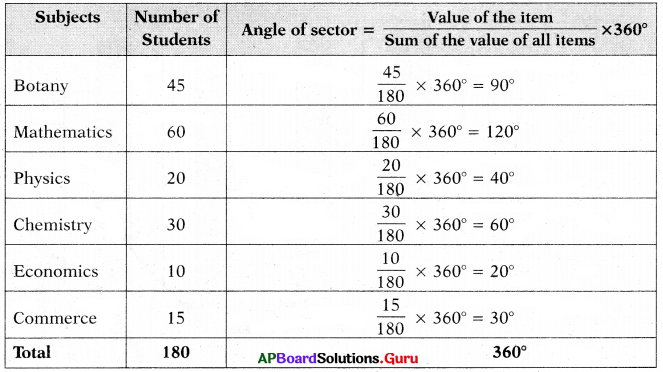
The angle of each sector will depend on the ratio between the number of students each subject and total number of students.
Angle of sector = \(\frac{\text { Value of the item }}{\text { Sum of the values of all items }}\) × 360°
Steps of construction:
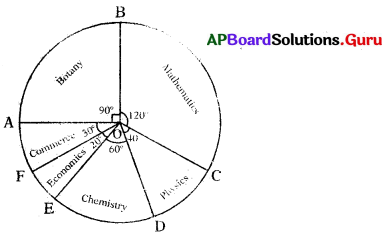
- Draw a circle with any convenient radius and mark it’s centre as ‘O’.
- Mark a point A, somewhere on the circumference and join OA.
- Construct ∠AOB = 90° to represent angle of the sector of Botany.
- Construct ∠BOC = 120° to represent angle of the sector of Mathematics.
- Construct ∠COD = 40° to represent angle of the sector of Physics.
- Construct ∠DOE = 60° to represent angle of the sector of Chemistry.
- Construct ∠EOF = 20° to represent angle of the sector of Economics.
- Now ∠FOA = 30° to represent angle of the sector of Commerce.