SCERT AP 7th Class Maths Solutions Pdf Chapter 6 Simple Equations Unit Exercise Questions and Answers.
AP State Syllabus 7th Class Maths Solutions 6th Lesson Simple Equations Unit Exercise
Question 1.
Runs made by two batsmen in 3 matches are given below.
Kohli: 49, 98, 72
Rohit: 64, 45, 83, then find the average of runs scored by Kohli and Rohit. Whose average is higher?
Answer:
Given runs made by Kohli: 49, 98, 72.
Average runs of Kohli = \(\frac{\text { Sum of the observations }}{\text { Number of observations }}\) = \(\frac{49+98+72}{3}\) = \(\frac{219}{3}\) = 73
Runs made by Rohit: 64, 45, 83.
Average runs of = \(\frac{64+45+83}{3}\)
= \(\frac{192}{3}\)= 64
73 > 64.
Kohli average is higher than Rohit.
Question 2.
Find mode of 38, 42, 35, 37, 45, 50, 32, 43, 43, 40, 36, 38, 43, 36 and 47. Verify whether it is Unimodal or Bimodal data.
Answer:
Given data : 38, 42, 35, 37, 45, 50, 32, 43, 43, 40, 36, 38, 43, 38, 47.
Arrange the given observations in ascending order.
![]()
As 38 and 43 occurs most frequently than other observations in the data.
∴ Mode = 38 and 43.
So, given data is Bimodal data.
Question 3.
The temperature in different places are 0, – 5, 7, 10, 13, – 1 and 41 in degree Celsius. Find the Median. If another observation, ‘4°C’ is added to the given data, is there any change in value of Median ? Explain.
Answer:
Given data : 0, – 5′, 7, 10, 13, – 1, 41.
Arrange the given observations in ascending order.
![]()
In seven observations the fourth observation 7 is the middle most value.
∴ Median = 7 .
If 4°C is added to the given data,
0, – 5, 7, 10, 13, – 1, 41 and 4.
Arrange the given observations in ascending order.
![]()
In eight observations the fourth and fifth observations 4 and 7 are the middle most values in the data.
Median = Average of the two middle most values.
= \(\frac{4+7}{2}\) = \(\frac{11}{2}\) = 5.5
So, if we added a new observation, then the median also changed (decreased). Median is decreased from 7 to 5.5.
Question 4.
If the range of observation 7x, 5x, 3x, 2x, x (x > 0) is 12, then find value of ‘x’ and express all the observations in numerical form.
Answer:
Given data.: 7x, 5x, 3x, 2x, x (x > 0) and Range = 12.
Maximum value = 7x; Minimum value = x
Range = Maximum value – Minimum value
= 7x – x – 12
⇒ 6x = 12 ⇒ \(\frac{6 x}{6}\) = \(\frac{12}{6}\)
∴ x = 12
Question 5.
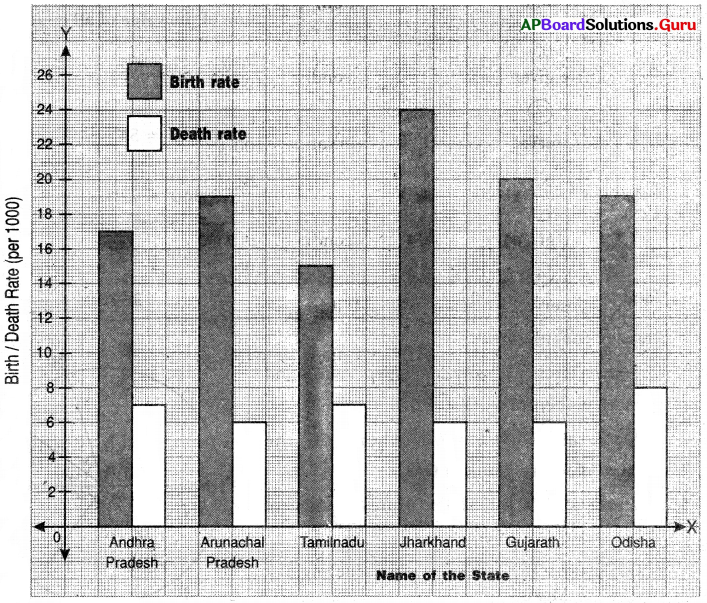
Birth and death rates of different states in 2015 are given below. Approximately draw a double bar graph for the given data.
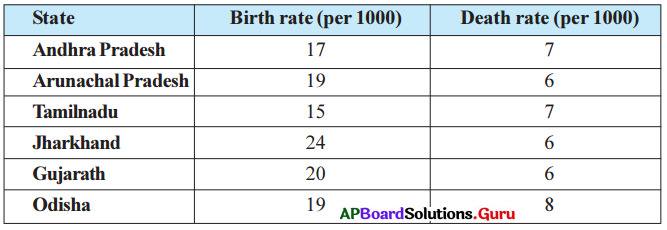
Answer:
Question 6.
The following data relates to the cost of construction of a house.

Draw a Pie diagram to represent the above data.
Answer:
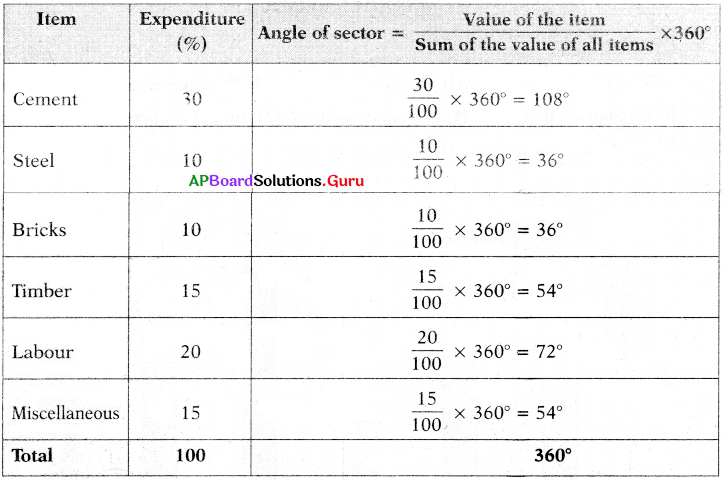
The angle of each sector will depend on the ratio between the number of students each item and total expenditure (%).
Angle of sector = \(\frac{\text { Value of the item }}{\text { Sum of the value of all items }}\) × 360°
Steps of construction:
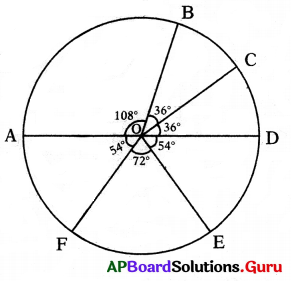
- Draw a circle with any convenient radius and mark it’s centre as ‘O’.
- Mark a point A, somewhere on the circumference and join OA.
- Construct ∠AOB = 108° to represent angle of the sector of Cement.
- Construct ∠BOC = 36° to represent angle of the sector of Steel.
- Construct ∠COD = 36° to represent angle of the sector of Bricks.
- Construct ∠DOE = 54° to represent angle of the sector of Timber.
- Construct ∠EOF = 72° to represent angle of the sector of Labour.
- Now ∠FOA = 54° to represent angle of the sector of Miscellaneous.