Andhra Pradesh BIEAP AP Inter 2nd Year Economics Study Material 10th Lesson Economic Statistics Textbook Questions and Answers.
AP Inter 2nd Year Economics Study Material 10th Lesson Economic Statistics
Essay Questions
Question 1.
What are the uses of dispersion?
Answer:
According to A.L.Bowley “Dispersion is the measure of the variation of the items”.
According to Brooks and Dick “Dispersion or spread is the degree of the scatter or variation of the variable about a central value”.
Uses of Dispersion :
- To use other statistical methods: After getting the value of dispersion we can proceed to other techniques such as locating co-relation or lines of regression (Regression Analysis).
- To compare variability: We are in the general habit of comparison, may it be income, weight, or temperature. To achieve the required degree of result one tries to improve to achieve the required result.
- To test the reliability of the average: If the total of differences between the central value and the given value is smaller, the uniformity is less i.e., it means that this sum should be minimum for the reliability of the average.
- To establish trends in time series: In time series we remove, cyclical, seasonal, or random fluctuations, which we from after studying central values.
- To control the undesired variability: According to Spurr and Bonini “In industrial production, the efficient operation requires control of quantity variation, the causes of which are sought through inspection and quality control programmes”.
Thus it is clear from the above definition that we have to find the cause for variation when we compare the degree of variability between two series.
![]()
Question 2.
What is meant by dispersion ? Explain the various measures of dispersion.
Answer:
The measurement of the scatteredness of the mass of figures in a series about an average is called a measure of variation or dispersion. According to A.LBowley “Disper-sion is the measure of the variation of the items”.
According to Brooks and Dick “Dispersion or spread is the scatter or variation of the variable about a central value.
Methods of studying variation :
- The range
- The interquartile range and the quartile deviation
- The mean deviation or average deviation
- The standard deviation and
- The Lorenz curve
1) Range : It is the simplest of the values of dispersion. It is merely the difference between the largest and smallest term- symbolically,
R = L – S
2) Inter – quartile range or quartile deviation: In range we used to calculate L – S terms. But in this case we leave the 1st 25% and last 25% terms to avoid the undue importance of extreme values.
Q.D = \(\frac{\mathrm{Q}_3-\mathrm{Q}_1}{2}\)
3) Mean deviation : It is the average difference between the items in a series from the mean or median or mode.
M.D. = \(\frac{\Sigma f|D|}{N}\)
4) Standard deviation : It is also called Root – Mean Square deviation, as it is the square root of the mean of the squared deviations from the actual mean.
S.D = \(\sqrt{\Sigma \frac{(x-\bar{x})^2}{N}}\)
σ = \(\sqrt{\frac{\sum \mathrm{x}^2}{\mathrm{~N}}}\)
5) Lorenz curve : It is graphic method to study dispersion. It helps in studying the variability in different components of distribution.
Question 3.
Calculate the quartile deviation for frequency distribution.
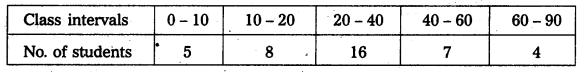
Solution:
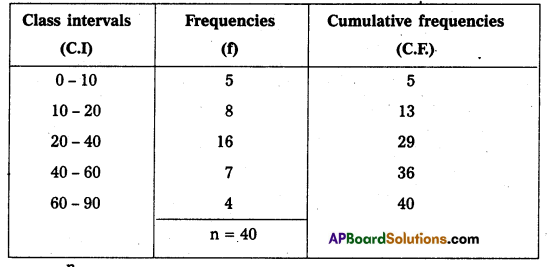
Q1 = L + \(\frac{\frac{\mathrm{n}}{4}-\mathrm{CF}}{\mathrm{f}}\) × i
Where Q1 = Size of \(\left(\frac{\mathrm{n}}{4}\right)^{\mathrm{th}}\) value = \(\left(\frac{\mathrm{10}}{4}\right)^{\mathrm{th}}\) = 10th item
L = Lower limit = 10
C.F = 5 (value of C.F for the class preceeding the quartile class)
i = 10 (frequency of the quartile class)
Q1 = 10 + \(\frac{10-5}{8}\) × 10 = 16.25
Similarly Q3 = L + \(\frac{3\left(\frac{n}{4}\right)-\text { C.F }}{f}\) × i
Where Q3 =\(\frac{3(n)}{4}=\frac{3(40)}{4}=\frac{120}{4}\) = (30)th item
C.F = 29, f = 7, i = 20, L = 40
L = 40
Q3 = 40 + \(\frac{30-29}{7}\) × 20 = 42.87
Q3 = 42.87
Q.D. = \(\frac{\mathrm{Q}_3-\mathrm{Q}_1}{2}\)
Q.D. = \(\frac{42.87-16.25}{2}\) = 13.31
∴ Q.D. = 13.31
![]()
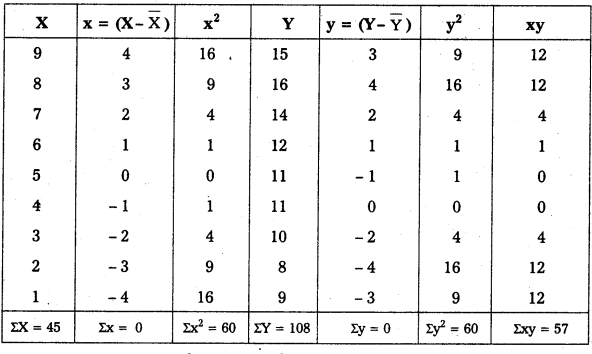
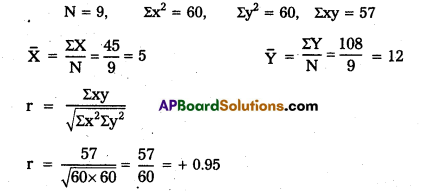
Question 4.
Calculate the Karl Pearson’s coefficient of correlation.
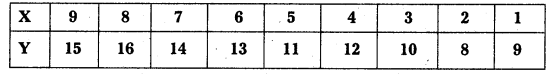
Solution:
Short Answer Questions
Question 1.
Define relation between M.D, S.D and Q.D.
Answer:
Measures of dispersion can be classified into five types.
- The range
- The inter quartile range and the quartile deviation
- The mean deviation or average deviation
- The standard deviation
- The Lorenz curve
The range and quartile deviations are positional measures because they depend on the values at a particular position in the distribution.
The average deviation and the standard deviation are called calculation measures of deviation because all of the values are employed in their calculation while the last method is a graphic method.
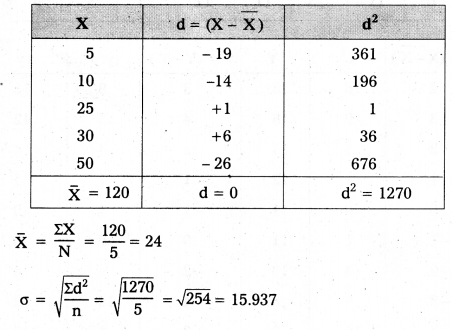
Question 2.
Calculate the standard deviation of the following values 5, 10, 25, 30, 50. [A.P. Mar. 17]
Solution:
![]()
Question 3.
Define Lorenz Curve. When is it used ?
Answer:
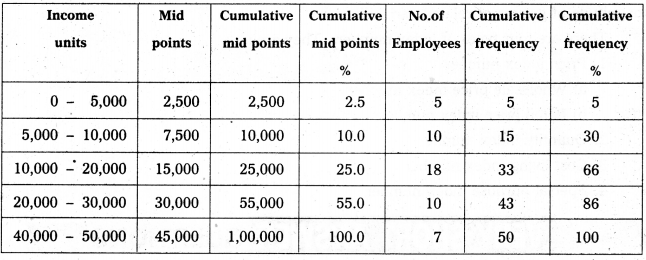
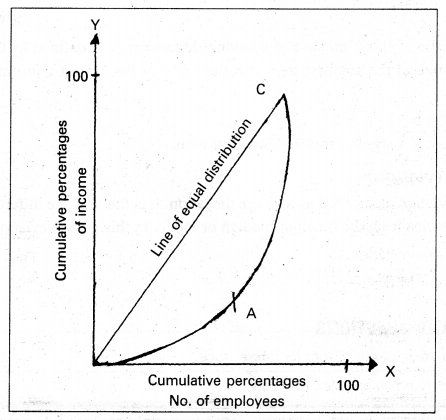
This curve was given by Dr. Max.O.Lorenz, a popular Economic statistician. He studied the distribution of wealth and income with its help. It is graphic method to study dispersion. It helps in studying the variability in different components of the distribution. The base of Lorenz curve is that we take cumulative percentage along X & Y axis. Joining these points we get the Lorenz curve.
Lorenz curve uses the information expressed in a cumulative manner to indicate the degree of variability.
For example: The monthly incomes of employees of a company given below.
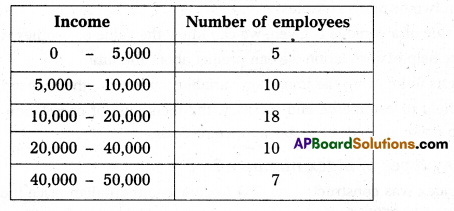
Solution:
Question 4.
What is correlation ? State its importance.
Answer:
Correlation is an analysis of the co-variation between two or more variables.
- The correlation is a statistical device which help to analyzing the co-variation between two or more variables.
- If the value of a variable is given, we can know the value of another variable.
- With the help of correlation we can predict about the future.
- It helps us in knowing the important variables on which other depend.
- In the field of commerce and industry, the technique of correlation coefficient helps to make estimates like sales, price or costs.
![]()
Question 5.
How many types of index numbers ?
Answer:
The first index was constructed in 1764 to compose the Italian price index in 1750 with the price level in 1500. Index numbers are devices for measuring difference in the magnitude of groups of related variabilities.
There are four types of index numbers. They are :
- Price index number
a) Wholesale price index number
b) Retail price index number - Quantity index number
- Cost living index number
- Special purpose index number
Very Short Answer Questions
Question 1.
Range. [A.P. Mar. 17, 16]
Answer:
Range is the simplest method of studying dispersion. It is defined as the difference between the value of the smallest item and the value of the largest item included in the distribution.
Range = L – S
Where L = Largest item; S = Smallest item.
Question 2.
Mean deviation.
Answer:
Mean deviation also called as average deviation. It is the average difference between the items in a series from the mean or median or mode. In this mean deviation we ignored ± signs.
M.D. = \(\frac{\Sigma \mathrm{f}|\mathrm{D}|}{\mathrm{N}}\)
![]()
Question 3.
Correlation. [A.P. Mar 17]
Answer:
Correlation is an analysis of the co-variation between two or more variables. There are two types of correlation.
- Karl Pearson’s method
- Spearman’s Rank method
Karl Pearson’s correlation (r) = \(\frac{\Sigma x y}{\sqrt{\Sigma x^2 \times \Sigma y^2}}\)
Spearman’s correlation (rk) = \(\frac{6 \Sigma D^2}{N\left(N^2-1\right)}\)
(Or) 1 – \(\frac{6 \Sigma D^2}{N^3-\mathrm{N}}\)
Question 4.
Rank correlation.
Answer:
In 1904, Prof. Charter Edward Spearman had devised a method of rank correlation. It is based on the ranking of different items in the variable. This method is useful where actual item values are not given simply their ranks in the series are known.
Question 5.
Index number. [A.P. Mar. 18]
Answer:
Index numbers are devices for measuring difference in the magnitude of groups related variabilities. There are four types of index numbers.
- Price index number
- Quantity index number
- Cost living index number
- Special purpose index number
Question 6.
Laspeyre’s price index formula.
Answer:
P01 = \(\frac{\Sigma \mathrm{P}_1 \mathrm{Q}_0}{\Sigma \mathrm{P}_0 \mathrm{Q}_0}\) × 100
![]()
Question 7.
Paasche’s price index formula. [A.P. Mar 16]
Answer:
P01 = \(\frac{\Sigma \mathrm{P}_1 \mathrm{Q}_1}{\Sigma \mathrm{P}_0 \mathrm{Q}_1}\) × 100
Question 8.
Fisher’s price index formula.
Answer:
P01 = \(\sqrt{\mathrm{L} \times \mathrm{P}}\)
= \(\sqrt{\frac{\Sigma \mathrm{P}_1 \mathrm{Q}_0}{\Sigma \mathrm{P}_0 \mathrm{Q}_0} \times \frac{\Sigma \mathrm{P}_1 \mathrm{Q}_1}{\Sigma \mathrm{P}_0 \mathrm{Q}_0}}\) × 100