Students get through Maths 2A Important Questions Inter 2nd Year Maths 2A Measures of Dispersion Important Questions which are most likely to be asked in the exam.
Intermediate 2nd Year Maths 2A Measures of Dispersion Important Questions
Question 1.
Find the mean deviation about the median for the data 4, 6, 9, 3, 10, 13, 2 (AP Mar. ’17) (TS. Mar. ’15 )
Solution:
Given ungrouped data are 4, 6, 9, 3, 10, 13, 2
Expressing the data in the ascending order of magnitude, we have 2, 3, 4, 6, 9, 10, 13
∴ Median = 6 b (say)
The absolute values are
|6 – 2|, |6 – 3|, |6 – 4|, |6 – 6|, |6 – 9|, |6 – 10|, |6 – 13| = 4, 3, 2, 0, 3, 4, 7

Question 2.
Find the mean deviation from the mean of the following discrete data 6, 7, 10, 12, 13, 4, 12, 16. (Mar. ’14)
Solution:
The A.M. of the given data \(\bar{x}\) = \(\frac{6+7+10+12+13+4+12+16}{8}\) = \(\frac{80}{8}\) = 10
The absolute values of thé deviations are
|6 – 10|, |7 – 10|, |10 – 10|, |12 – 10|, |13 – 10|, |4 – 10|, |12 – 10|, |16 – 10|
= 4, 3, 0, 2, 3, 6, 2, 6
∴ The mean deviation from the mean = \(\frac{1}{n} \sum_{i=1}^{n}\left|x_{i}-\bar{x}\right|\)
= \(\frac{1}{8}\) (4 + 3 + 0 + 2 + 3 + 6 + 2 + 6) = \(\frac{26}{8}\) = 3.25
Question 3.
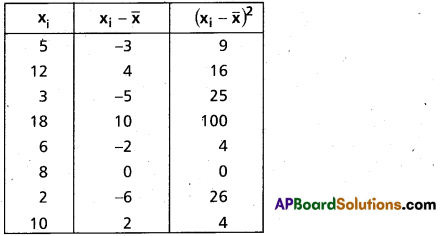
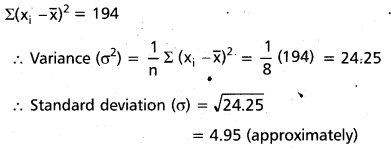
Find the variance and standard deviation of the following data 5, 12, 3, 18, 6, 8, 2, 10 (A.P. Mar. ’15)
Solution:
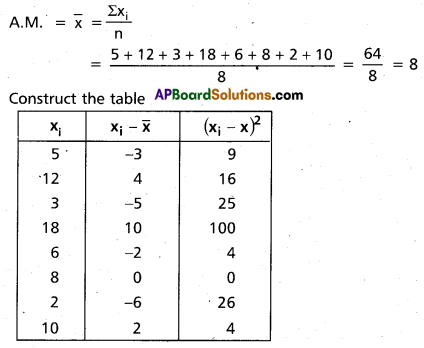
A. M. = \(\bar{x}\) = \(\frac{\Sigma x_{i}}{n}\) = \(\frac{5+12+3+18+6+8+2+10}{8}\) = \(\frac{64}{8}\) = 8
Construct the table
Question 4.
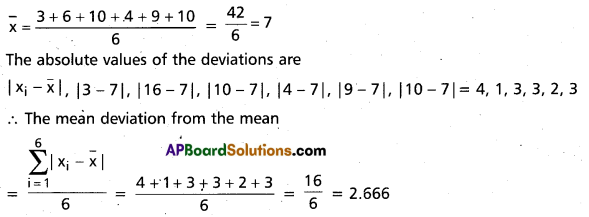
Find the mean deviation about the mean for the following data 3, 6, 10, 4, 9, 10 (TS Mar. ’17)
Solution:
The arithmetic mean of the given data
Question 5.
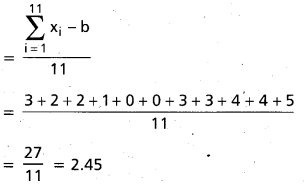
Find the mean deviation about the median for the data 13, 17, 16, 11, 13, 10, 16, 11, 18, 12, 17. (AP. Mar. ’16)
Solution:
Given ungrouped data are
13, 17, 16, 11, 13, 10, 16, 11, 18, 12, 17
Expressing the data in the ascending order of magnitude, we have
10, 11, 11, 12, 13, 13, 16, 16, 17, 17, 18
∴ Median = 13 = b(say)
The absolute values are
|13 – 10|, |13 – 11|, |13 – 11|, |13 – 12|, |13 – 13|, |13 – 13|, |13 – 16|, |13 – 16|, |13 – 17|, |13 – 17|, |13 – 18|
= 3, 2, 2, 1, 0, 0, 3, 3, 4, 4, 5
Mean deviation from the median
![]()
Question 6.
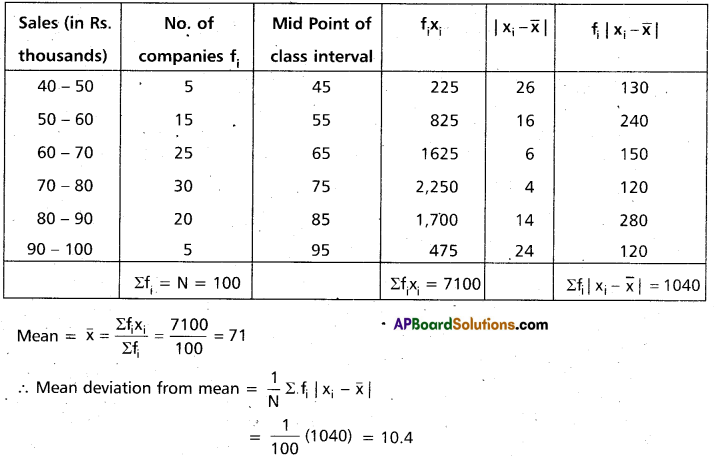
Find the mean deviation about the mean for the following data. (AP Mar. ‘15)

Solution:
Construct the table
Question 7.
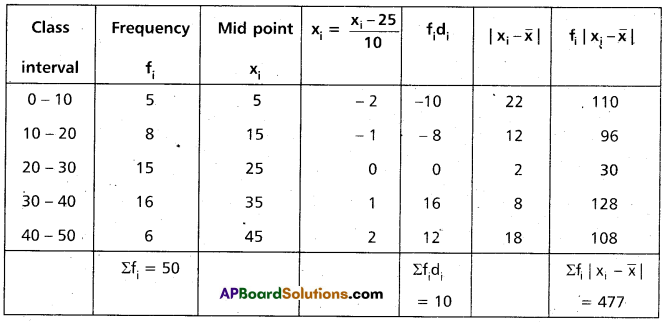
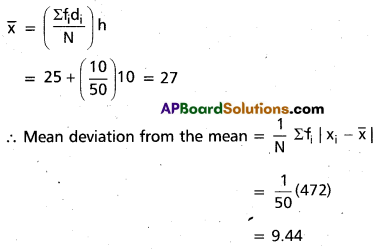
Find the mean deviation about the mean of the following data (AP Mar. ’17, ’16)

Solution:
Taking the assumed mean a = 25 and h = 10
Construct the table
Question 8.
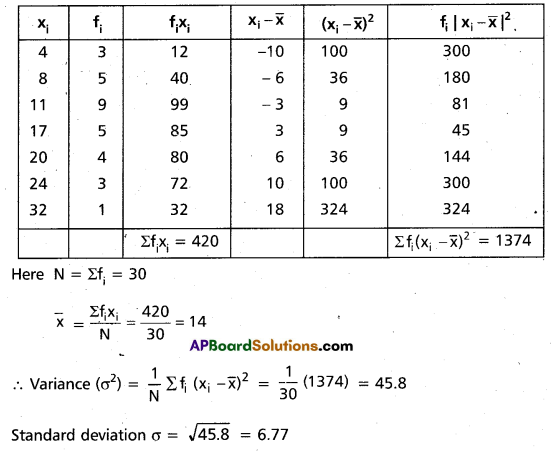
Find the variance and standard deviation of the following data

Solution:
Construct the table
![]()
Question 9.
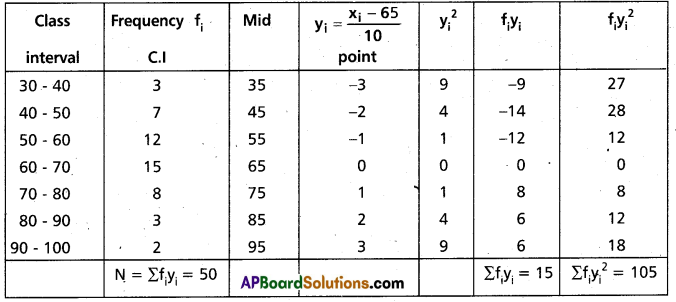
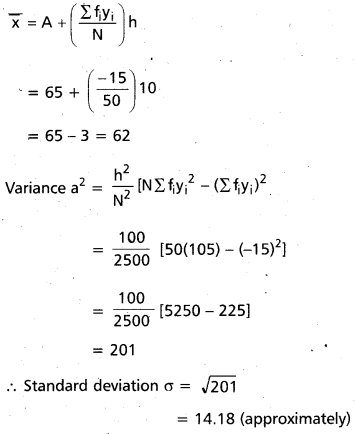
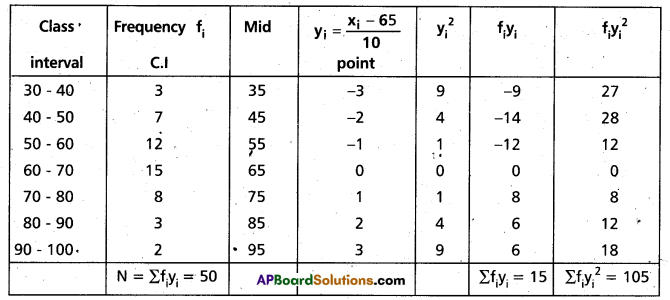
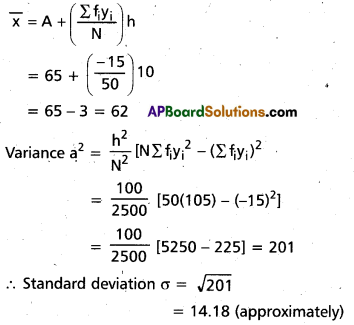
Calculate the variance and standard deviation of the following continuous frequency distribution.

Solution:
Let assumed mean A = 65
Then yi = \(\frac{x_{i}-65}{10}\)
Construct the table
Question 10.
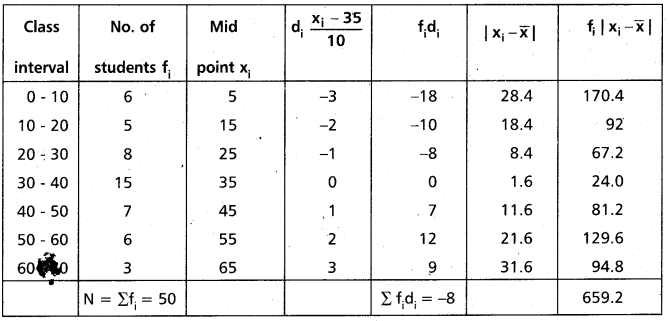
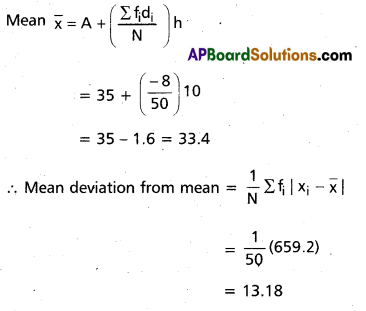
Find the mean deviation from the mean of the following data using step deviation method. (AP Mar. ’16)

Solution:
Let assumed mean A = 35
Then di = \(\frac{x_{i}-35}{10}\)
Construct the table
Question 11.
Find the mean deviation from the mean of the following discrete data 6, 7, 10, 12, 13, 4, 12, 16. (Mar – 2014)
Solution:
The A.M. of the given data \(\bar{x}\) = \(\frac{6+7+10+12+13+4+12+16}{8}\)
= \(\frac{80}{8}\) = 10
The absolute values of the deviations are
|6 – 10|, |7 – 10|, |10 – 10|, |12 – 10|, |13 – 10|, |4 – 10|, |12 – 10|, |16 – 10| = 4, 3, 0, 2, 3, 6, 2, 6

Question 12.
Find the mean deviation from the median of discrete data 6, 7, 10, 12, 13, 4, 12, 16
Solution:
Given data points are 6, 7, 10, 12, 13, 4, 12, 16
Expressing the data points in the ascending order of magnitude 4, 6, 7, 10, 12, 12, 13, 16
∴ Median = \(\frac{10+12}{2}\) =11
The absolute values of the deviations are
|11 – 4|, |11 – 6|, |11 – 7|, |11 – 10|, |11 – 12|, |11 – 12|, |11 – 13|, |11 – 16|
= 7, 5, 4, 1, 1, 1, 2, 5
∴ Mean deviation from the median = \(\frac{1}{8}\)(7 + 5 + 4 + 1 + 1 + 1 + 2 + 5)
= \(\frac{26}{8}\) = 3.25
![]()
Question 13.
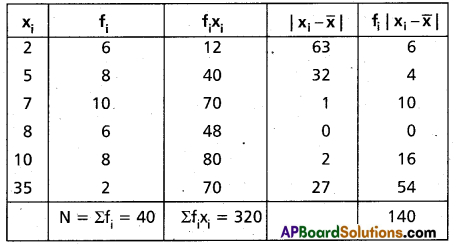
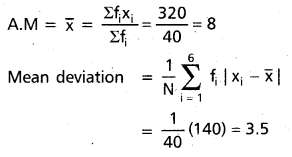
Find the mean about the mean for the following data.

Solution:
Construct the table
Question 14.
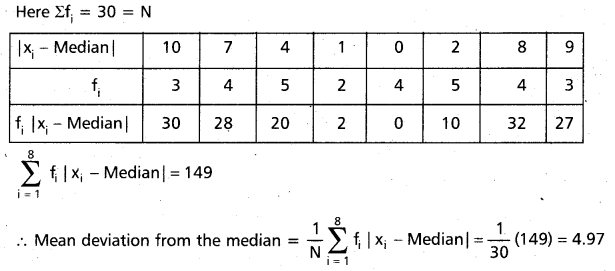
Find the mean deviation from the median for the following data

Solution:
Given observations in the ascending order, we get the following distribution.

Median of these observations = 13
![]()
Question 15.
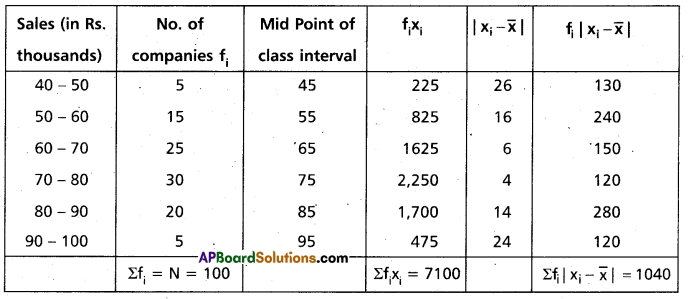
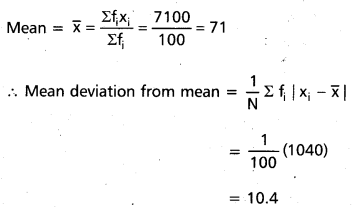
Find the mean deviation about the mean for the following data (A.P. Mar. ’15)

Solution:
Construct the table
Question 16.
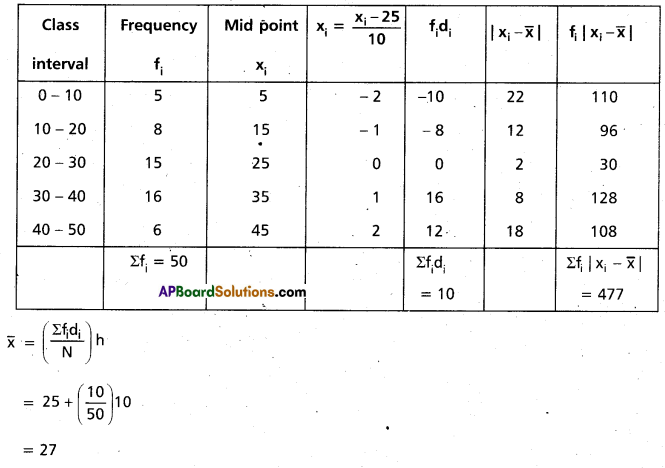
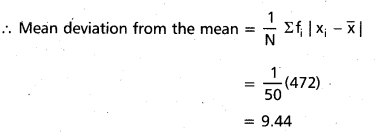
Find the mean deviation about the median for the following data (A.P. Mar. ’16)

Solution:
Taking the assumed mean a = 25 and h = 10
Construct the table
Question 17.
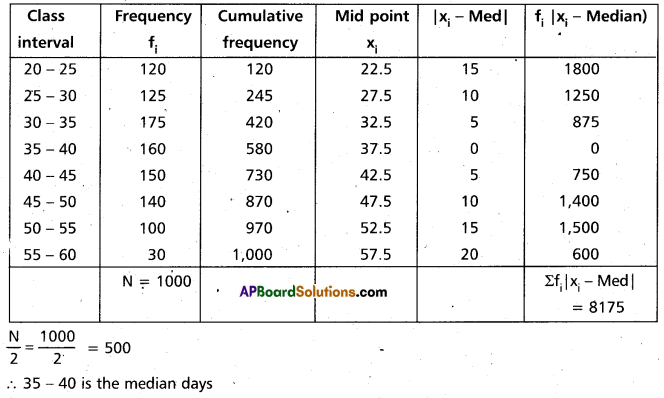
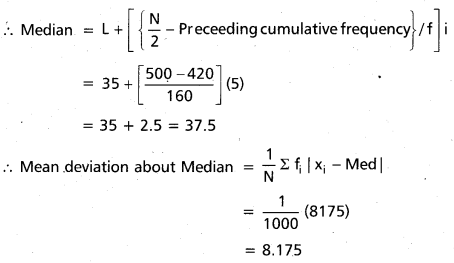
Find the mean deviation about the median for the following data

Solution:
Construct the table
![]()
Question 18.
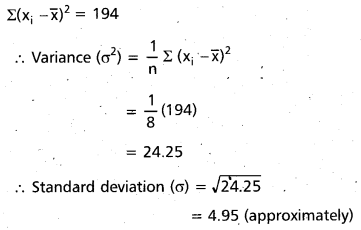
Find the variance and standard deviation of the following data 5, 12, 3, 18, 6, 8, 2, 10 (A.P. Mar. ’15)
Solution:
Question 19.
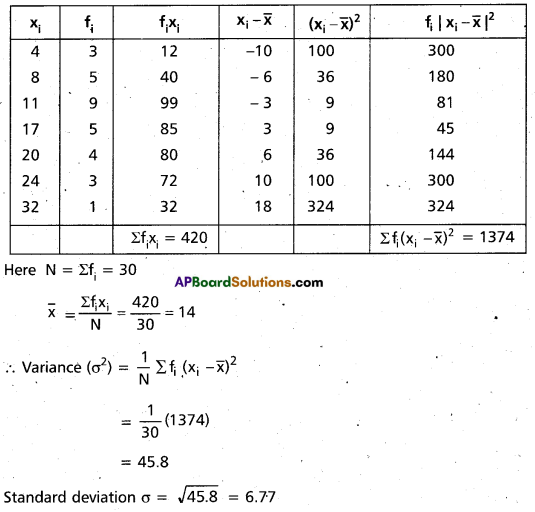
Find the variance and standard deviation of the following data

Solution:
Construct the table
Question 20.
Calculate the variance and standard deviation of the following continuous frequency distribution. (Mar. 2014)

Solution:
Let assumed mean A = 65
Then yi = \(\frac{x_{i}-65}{10}\)
Construct the table
![]()
Question 21.
Students of two sections A and B of a class show the following performance in a test (conducted for 100 marks)

Which section of students has greater variability in performance?
Solution:
In section — A variance or the distribution \(\sigma_{1}^{2}\) = 64
⇒ S.D. σ1 = 8
In section — 8 variance of the distribùtion \(\sigma_{2}^{2}\) = 81
⇒ S.D. σ2 = 9
Since the average marks of both sections of students is the same i.e., 45
∴ The section with greater S.D. will have more variability. Hence section B has greater variability in the performance.
Question 22.
Lives of two models or refrigerators A and B obtained in a survey are given below:
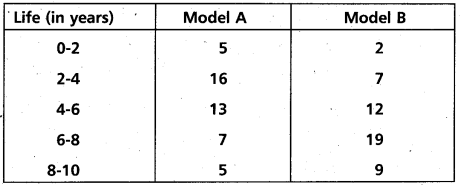
Which refrigerator model would you suggest to purchase?
Solution:
First to find the mean and variance of the lives of model A and Model B of refrigerators.
Construct the table.
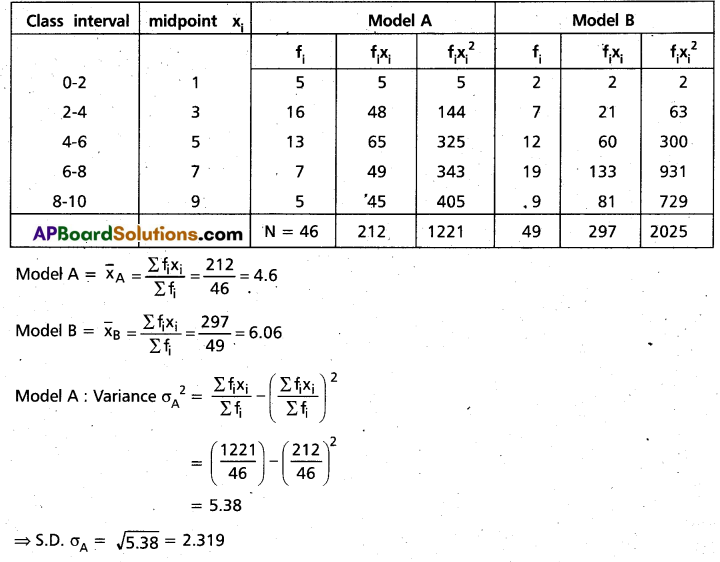
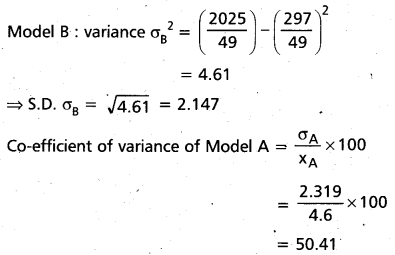
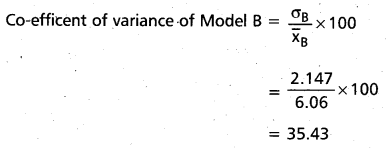
Since C.V. of model B < C.V. of model A
∴ Model B is more consistent than the model A with regard to life in years.
Hence we suggest Model B for purch.
Question 23.
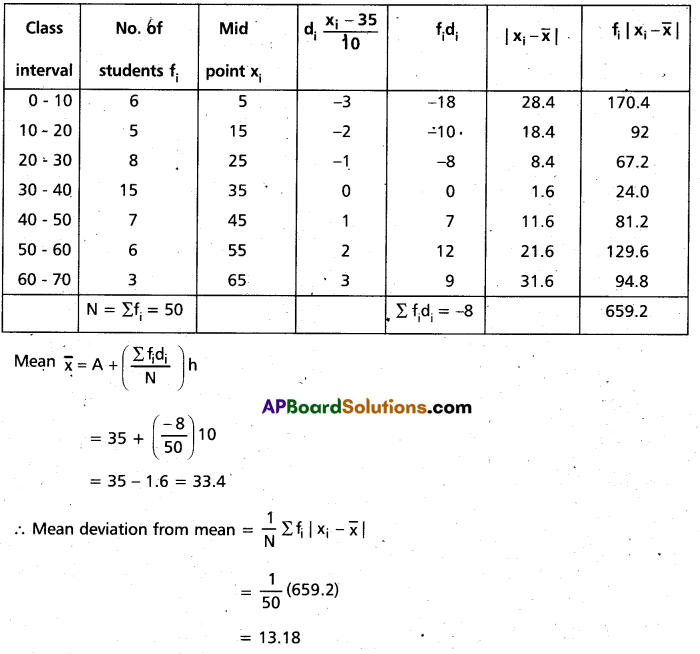
Find the mean deviation from the mean of the following data using step deviation method.

(T.S. Mar. ‘16)
Solution:
Let assumed mean A = 35
Then di = \(\frac{x_{i}-35}{10}\)
Construct the table
![]()
Question 24.
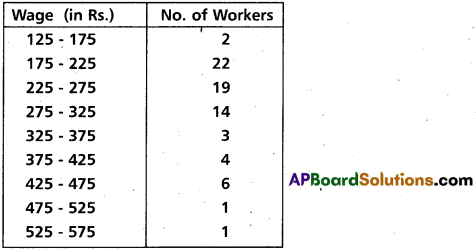
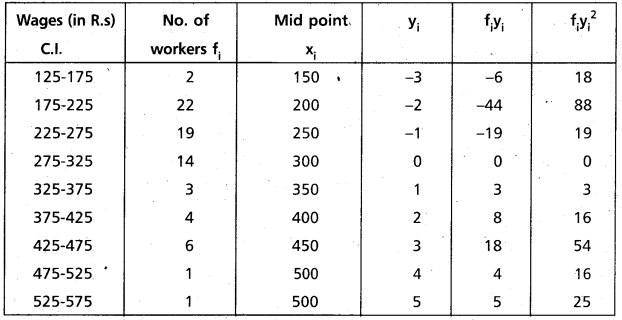
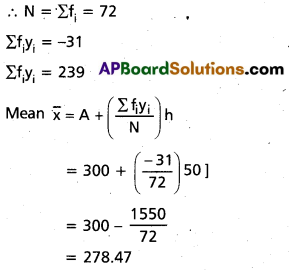
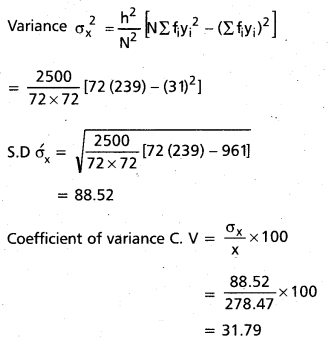
The following table gives the daily wages of workers in a factory. Compute the standard deviation and the co-efficient of variation of the wages of the workers.
Solution:
To solute this problem using the step deviation method.
Here h = 50
Let assumed mean A = 300
Then yi = \(\frac{x_{i}-300}{50}\)
Construct the table
Question 25.
An analysis or monthly wages paid to the workers of two firms A and B belonging to the same industry gives the following data.

i) Which firm A or B. has greater variability in industrial wages?
ii) Which firm has large wage bill?
Solution:
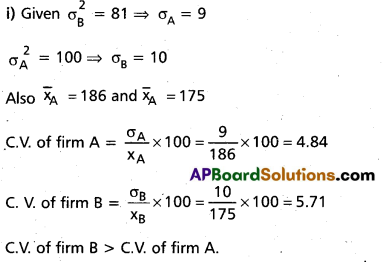
∴ firm B has greater variability in industrial wages.
ii) Total wages paid to the workers in firm
A = 500 × 186
= 93,000
Total wages paid to the workers in form
B = 600 × 175
= 1,05,000
Hence firm B has larges wage bill.
Question 26.
The variance of 20 observations in 5. If each of the observation is multiplied by 2, find the variance of the resulting observations.
Solution:
Let x1, x2 …, x20 be the given observations and \(\bar{x}\) be their mean.
Given n = 20 and variance = 5
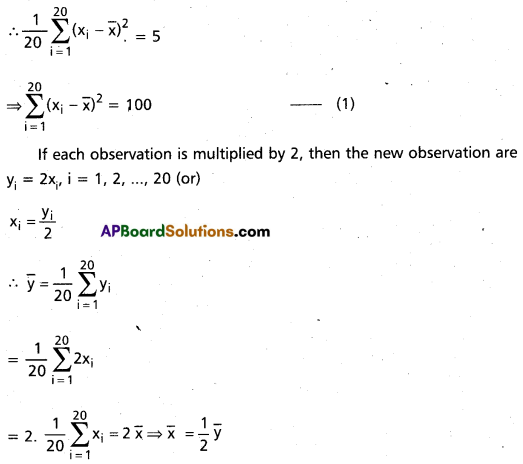
Substituting the values of xi and in (1), we get
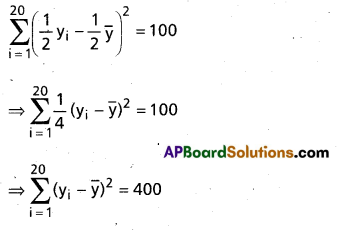
∴ The variance of the resulting observations = \(\frac{1}{20}\) × 400 = 20
= 22 × 5
![]()
Question 27.
If each of the observations x1, x2 ….. xn is increased by k, where k is a positive or negative number, then show that the variance remains unchanged.
Solution:
Let \(\overline{\bar{x}}\) be the mean of x1, x2 …. xn. Then their variance is given by \(\sigma_{1}^{2}\) = \(\frac{1}{n} \sum_{i=1}^{n}\left(x_{i}-\bar{x}\right)^{2}\)
If to each observation we add a constant k, then the new (changed) observations will be yi = xi + k
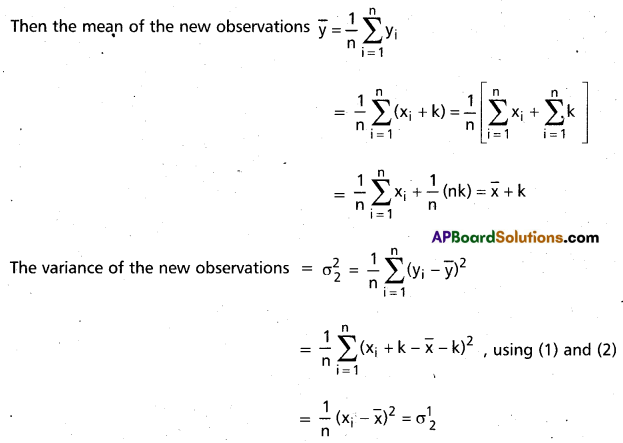
Thus the variance of the new observations is the same as that of the original observations.
Question 28.
The scores of two cricketers A and B in 10 innings are given below. Find who is a better run getter and who ¡s a more consistent player.

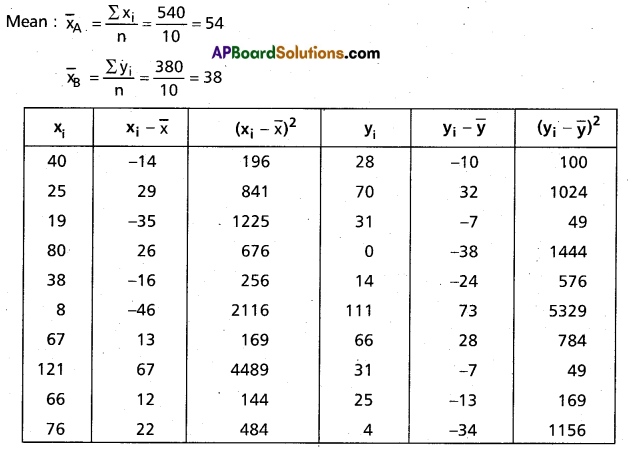
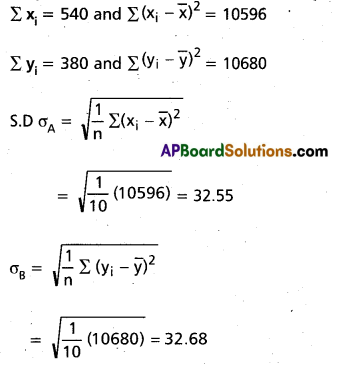
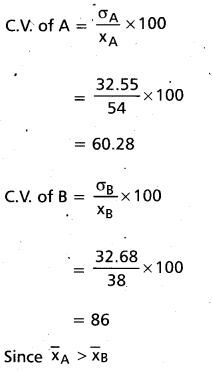
Cricketer A is a better run getter
Since C.V. of A < C.V. of B
Hence cricketer A is a more consistent players.