Students can go through AP State Board 9th Class Physical Science Notes Chapter 12 Units and Graphs to understand and remember the concept easily.
AP State Board Syllabus 9th Class Physical Science Notes Chapter 12 Units and Graphs
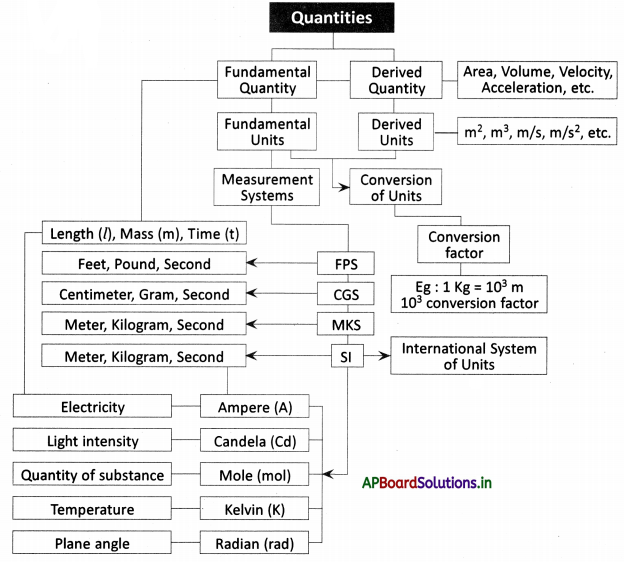
→ A unit is a standard measure used for comparing measurements.
→ Units should be placed right side of the magnitude of every physical quantity.
For Example 2 kilograms, 100 grams.
→ The main fundamental quantities are mass (m), length (l), time (t).
→ Fundamental quantities are those physical quantities that cannot be expressed in terms of other quantities.
→ Fundamental quantities are also called base quantities.
→ Scientists evolved different types of measuring systems such as FPS, CGS, MKS, etc.
- FPS System: Foot – Pound – Second.
- CGS System: Centimeter – Gram – Second.
- MKS System: Meter – Kilogram – Second.
→ SI System is an International System of units.
→ In addition to mass, length, and time some other fundamental quantities were added to the SI system.
→ Units in SI System:
- Length – Meter (m)
- Mass – Kilogram (kg)
- Time – Second (s)
- Electricity – Ampere (A)
- Light intensity – Candela (Cd)
- Quantity of substance – Mole (Mol)
- Temperature – Kelvin (K)
- Plane angle – Radian (rad)
→ The quantities that are obtained by combining fundamental quantities either by multiplication or division or both operations are called derived quantities.
→ Some derived quantities are speed, velocity, area, volume, density, acceleration, force, pressure, etc.
→ Derived units are units of measurements derived from the fundamental units.
→ Some examples of derived units are
- Area – m2
- Volume – m3
- Speed – m/s
- Velocity – m/s
- Acceleration – m/s
- Force – \(\frac{\mathrm{kg}}{\mathrm{m} / \mathrm{s}^{2}}=\frac{\mathrm{kg} \cdot \mathrm{s}^{2}}{\mathrm{~m}}\) , etc.
→ We need to convert units of a physical quantity into a single system to compare both values.
For example: To compare 1500 m and 1.5 km Convert km into meters.
Then 1500 m = 1500 m, 1.5 km = 1500 m
Hence both values are equal.
![]()
→ 1000 m = 1 km
1000 is prefixed to meter called as ‘Kilo’
→ 1 km/hr = \(\frac{5}{18}\)m/s
→ Meter is the distance travelled by light in a vacuum in \(\frac{1}{299792458}\) seconds
→ There are some rules to follow while writing units.
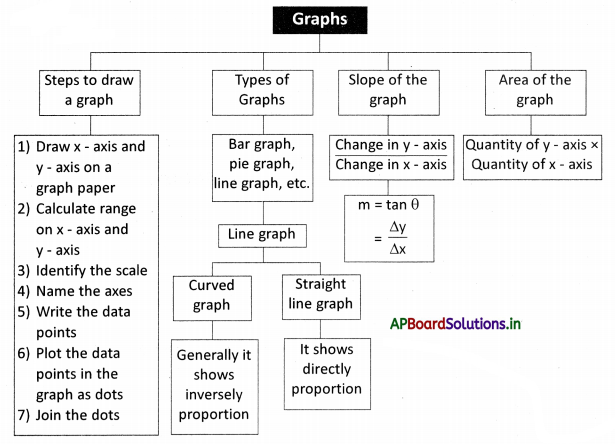
→ A pictorial form of representation that shows the relation between two quantities can be called a graph.
→ The expressed quantity depends on the independent and dependent variables taken for plotting the graph.
→ Generally, independent variables are controlled or decided by us, but dependent variables are changed due to the change independent variable.
→ The thick horizontal line on the graph paper is called X-axis.
→ The thick vertical line on the graph paper is called Y-axis.
→ The Independent variable should be taken on the x-axis, whereas the dependent variable is on the y – axis.
→ The range is the difference between the highest value and lowest value of the data.
Range = highest value – lowest value.
→ Scale on X-axis = \(\frac{\text { Range }}{\text { The number of grids on } \mathrm{X} \text { -axis }}\)
Scale on y-axis = \(\frac{\text { Range }}{\text { The number of grids on } \mathrm{Y} \text { -axis }}\)
→ Axes should be named with the quantity taken on it along with their units.
→ The values taken as pairs such as (x1, y1), (x2, y2), are called data points.
![]()
→ If a graph is curved in shape, it is called a curved graph.
→ If a graph is a straight line, it is called a straight line graph.
→ Both curved, straight-line graphs are called line graphs.
→ Hooke’s Law: Elongation of the spring is proportional to mass.
The graph of extension and mass is a straight-line graph and it indicates the relationship of direct proportional between extension and mass.
→ Direct proportion:
- The initial values should be counted as “0”.
- The ratio of any pair has to be constant.
- If the value of one quantity increases, the value of the second quantity also increases.
→ Inverse proportional:
- The value of one quantity should be “0”, the value of the second quantity cannot be defined, it can be infinite.
- The product of any two pairs should be constant.
- The value of one quantity increases, the value of the second quantity should be decreased.
→ Pressure ∝ \(\frac{1}{\text { Volume }}\) [inversely proportionally]
The graph of pressure and volume is parabolic in shape.
→ Slope of the straight line = \(\frac{\text { Change in } y \text { -coordinates }}{\text { Change in } x \text { -coordinates }}=\frac{\text { rise }}{\text { run }}\) (or) tan θ = \(\frac{\Delta y}{\Delta x}\)
→ The slope of the graph is denoted by “m”.
→ The slope of the straight line increases along with the increase of angle.
![]()
→ The slope of the X-axis is zero.
→ Slope can be determined by coordinates of x, y, or by the angle of a straight line with the X-axis.
→ A curved line graph has an infinite number of slopes.
→ We can calculate the slope at any point on the curve by drawing a tangent to it.
→ The ratio of the Y and X-axis represents slope.
→ The product of quantities on the Y and X-axis is said to be an area of the graph.
→ Unit: A unit is a standard measure used for comparing measurements.
→ Fundamental: Fundamental quantities are those physical quantities that quantities cannot be expressed in terms of other quantities.
→ Basic quantities: Fundamental quantities are also called basic quantities.
→ FPS: Foot, Pound, Second.
→ CGS: Centimeter, Gram, Second.
→ MKS: Meter, Kilogram, Second.
→ SI System: International System of units.
→ Derived quantities: The quantities that are obtained by combining fundamental quantities either by multiplication or division or both operations are called derived quantities.
→ Some fundamental: Length, Mass, Time, Electricity, Light intensity, Quantity of quantities substance, Temperature, Plane angle.
→ Some derived quantities: Area, Volume, Density, Velocity, Acceleration, Force, Pressure.
→ Fundamental Units: Meter, Kilogram, Second, Ampere, Candela, Mole, Kelvin, Radian.
→ Derived Units: Derived units are units of measurement derived from the fundamental units. m2, m3, kg/m3, m/s, m/s2.
→ Meter: Meter is the distance travelled by light in a vacuum in \(\frac{1}{299792458}\) seconds
![]()
→ Graph: A pictorial form of representation that shows the relation between two quantities can be called a graph.
→ Independent: The variable which is controlled or decided by us to plot a graph variable is called the independent variable.
→ Dependent variable: The variable which is changed due to the change in the independent variable is called the dependent variable.
→ Grids: Grids of one square centimeter form by the intersection of thick lines and one square millimeter grid form with the intersection of thin lines in graph paper.
→ X-axis: The thick horizontal line on the graph paper is called X-axis.
→ Y-axis: The vertical thick line is called Y-axis.
→ Range: The highest value – the lowest value.
→ Scale: The interval taken to point the values on the axes is called scale.
Scale = \(\frac{\text { Range }}{\text { The number of grids on the axis }}\)
→ Data points: The values are to be taken as pairs in order to mark them as points on the graph such as (x, y) is called data points.
→ Curved line graph: If the line in a graph is in a curved shape, then the graph is called a curved line graph.
→ Straight-line graph: If the line in a graph is a straight line, then the graph is called a straight-line graph.
→ The slope of a straight: The ratio between the change in y-coordinates and the line graph x – coordinates gives the slope of the straight-line graph.
→ Slope = \(\frac{\text { Change in } y \text { -coordinates }}{\text { Change in } x \text { -coordinates }}=\frac{\text { rise }}{\text { run }}\) (or) tan θ = \(\frac{\Delta y}{\Delta x}\)
The slope is denoted with ‘m’.
![]()
→ Area of graph: The product of the physical quantity of the Y-axis and X-axis is said to be an area of the graph.
→ Robert Hooke:
- Born: 28th July (O.S. 18 July) 1635
- Died: 3rd March 1703 (aged 67)
- Nationality: English
- Alma mater: Wadham College, Oxford
- Known for: Hooke’s law, Microscopy,
- Coining the word ‘cell’
- Fields: Physics and Chemistry
- Institutions: Oxford University Academic
- Advisors: Robert Boyle
- Influences: Richard Busby