Students can go through AP SSC 10th Class Maths Notes Chapter 14 Statistics to understand and remember the concepts easily.
AP State Syllabus SSC 10th Class Maths Notes Chapter 14 Statistics
→ Statistics is a branch of mathematics which deals with collection, organisation, presentation, analysis and interpretation of numerical data.
→ Data is a collection of actual information which is used to make logical inferences.
→ Arithmetic Mean of raw data:
The Arithmetic Mean (A.M.) of a raw data viz. x1, x2, x3, ……., xn is the sum of values of all observations divided by the number of observations.
Arithmetic Mean (A.M.) = 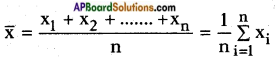
Eg.: Sita secured 23, 24, 24, 22 and 20 marks in a test. Her mean marks are
A.M. = \(\frac{23+24+24+22+20}{5}\) = \(\frac{113}{5}\) = 22.6
![]()
→ A.M. by direct method:
Let x1, x2, x3, ……., xn be observations with respective frequencies f1, f2, ……, fn
i.e., x1 occurs for f1 times, x2 occurs for f2 times, ….., xn occurs for fn times.
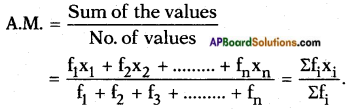
→ For a grouped data, it is assumed that the frequency of each class interval is centered around its mid-point and the A.M. is given by A.M. = \(\frac{\Sigma \mathrm{f}_{\mathrm{i}} \mathrm{x}_{\mathrm{i}}}{\Sigma \mathrm{f}_{\mathrm{i}}}\)
→ A.M. by deviation method, \(\overline{\mathbf{x}}=\mathbf{a}+\frac{\Sigma \mathbf{f}_{\mathbf{i}} \mathbf{d}_{\mathbf{i}}}{\Sigma \mathbf{f}_{\mathbf{i}}}\)
where, a – assumed mean
di – deviation = xi – a.
Step – 1: Choose ‘a’ from the central values.
Step – 2: Obtain di by subtracting a from xi.
Step – 3: Multiply fi and di.
Step – 4: Find ∑fidi and ∑fi .
Step – 5: Find \(\overline{\mathbf{x}}=\mathbf{a}+\frac{\Sigma \mathbf{f}_{\mathbf{i}} \mathbf{d}_{\mathbf{i}}}{\Sigma \mathbf{f}_{\mathbf{i}}}\)
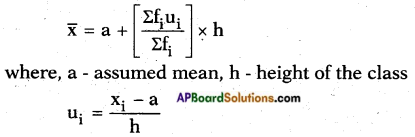
→ A.M. by step-deviation method:
Step – 1: Choose ‘a’ from mid values.
Step – 2: Obtain ui = \(\frac{x_{i}-a}{h}\).
Step – 3: Multiply fi and ui.
Step – 4: Find Efiui and Sfi.
Step – 5: Find \(\overline{\mathrm{x}}=\mathrm{a}+\left(\frac{\Sigma \mathrm{f}_{\mathrm{i}} \mathrm{u}_{\mathrm{i}}}{\Sigma \mathrm{f}_{\mathrm{i}}}\right) \times \mathrm{h}\)
![]()
→ Mode : Mode is the size of variable which occurs most frequently.
→ Mode of a grouped data:
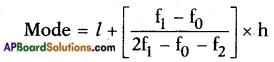
Where, l – lower boundary of the modal class,
h – size of the modal class interval,
f1 – frequency of modal class.
f0 – frequency of the class preceding the modal class.
f2 – frequency of the class succeeding the modal class.
→ Median: Median is defined as the measure of the central items when they are in descending or ascending order of magnitude.
→ Median for a grouped data:
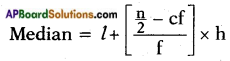
where,
l – lower boundary of median class,
n – number of observations.
cf – cumulative frequency of class preceding the median class.
f – frequency of median class.
h – size of the median class.
→ Cumulative frequency curve or an ogive:
First we prepare the cumulative frequency table, then the cumulative frequencies are plotted against the upper or lower limits of the corresponding class intervals. By joining the points the curve so obtained is called a cumulative frequency or ogive.
Ogives are of two types.
- Less than ogive: Plot the points with the upper limits of the classes as abscissa and the corresponding less than cumulative frequencies as ordinates. The points are joined by free hand smooth curve to give less than cumulative frequency curve or the less than ogive. It is a rising curve.
- Greater than ogive: Plot the points with the lower limits of the classes as abscissa and the corresponding greater than cumulative frequencies as ordinates. Join the points by a free hand smooth curve to get the greater than ogive. It is a falling curve.
When the points are joined by straight lines, the figure obtained is called cumulative frequency polygon.
![]()
→ Median can be obtained from cumulative frequency curve: From \(\frac{n}{2}\) frequency draw a line parallel to X-axis cutting the curve at a point. From this point draw a perpendicular to the axis. The point at which the perpendicular meets the X – axis determines the median.
Less than type and greater than type curves intersects at a point. From this point of intersection if we draw a perpendicular on the X-axis then this cuts X-axis at some point. This point gives the median.