Students can go through AP Board 7th Class Maths Notes 6th Lesson Data Handling to understand and remember the concept easily.
AP Board 7th Class Maths Notes 6th Lesson Data Handling
→ Dr. Caiyampudi Radhakrishna Rao (C.R. Rao) – India:
A wellknown statistician, famous for his theory of estimations. He worked on Cramer – Rao Inequality and Fisher – Rao theorem. His schooling was completed in Gudur, Nuzvid, Nandigama and Visakhapatnam. He studied M.A (Mathematics) in Andhra University. He obtained a Ph.D.Degree under the guidance of Sir R.A. Fisher.
→ The information either in form of pictures, numbers or words is called ‘Data’.
→ Based on the method of collecting information the data is divided into two different types namely ‘Primary, data’ and ‘Secondary data’.
→ The difference between maximum and minimum values of data is its ‘Range’.
→ The most common representative or Central Tendency Value of a grouped data is average or Arithmetic Mean.
→ Arithmetic Mean = \(\frac{\text { Sum of observations }}{\text { Number of observations }}\)
→ Arithmetic Mean of given data always lies between the lowest and highest observations in the data.
→ The observation which occurs most frequently in the given data is ‘Mode’.
→ Data having only one mode is Unimodal data and data having two modes is Bimodal data.
→ The middle most value of the data when the observations are arranged in either ascending or descending order is called Median.
![]()
→ If number of observations(n) is odd, then Median is \(\left(\frac{\mathrm{n}+1}{2}\right)^{\text {th }}\) observations.
→ If number of observations(n) is even, then median is average of \(\left(\frac{\mathrm{n}}{2}\right)^{\text {th }}\) and \(\left(\frac{\mathrm{n}}{2}+1\right)^{\mathrm{th}}\) observations.
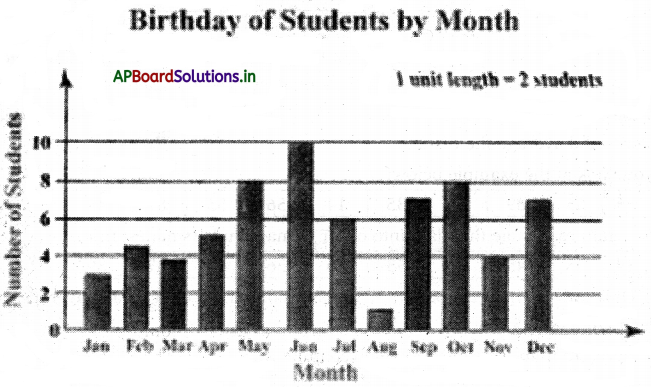
→ Representation of numerical data by using bars of uniform width is Bar graph.
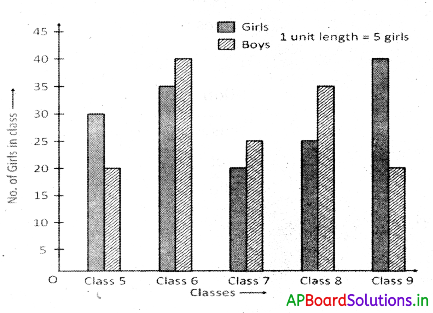
→ Representation of two sets of numerical data on the same graph by using bars of uniform width is Double bar graph.
→ A Pie chart is the representation of the numerical data by sectors of the circle such that angle of each sector (area of sector) is proportional to value of the given data.
→ Angle of sector = \(\frac{\text { Value of the item }}{\text { Sum of the values of all items }}\) × 360°
→ Data : The information which collected either in the form of numbers, words or pictures is called Data.
Example : Marks obtained by a class at EA are 23, 35, 48, 30, 25, 46, 13, 27, 32, 38,
→ Primary data : The data collected directly through personal experiences, interviews, direct observations, physical testing etc., is called primary data. It is also described as raw data or first hand information.
Example :
- Performance of your class in Mathematics.
- Performance of India in football or in cricket.
- Number of children below the age of five in the families around you.
→ Secondary data : Secondary data is the information which has been collected in the past by someone else but used by the investigator for his own purpose. The sources of secondary data are books, journals, newspapers, websites etc.
Example :
- Collection of village population details from census register.
- Female literacy rate in a given area.
![]()
→ Measures of Central Tendency : A measure of central tendency is a single value that attempts to describe a set of data by identifying the central position within that set of data. The mean, median and mode are all valid measures of central tendency, but under different conditions, some measures of central tendency become more appropriate to use than others.
→ Arithmetic Mean: The mean (or average) is the most popular and well known measure of central tendency. The average or Arithmetic Mean (A.M.) or simply mean is defined as follows:
Mean = \(\frac{\text { Sum of all observations }}{\text { Number of observations }}\)
Example : Sita studies for 4 hours, 5 hours and 3 hours respectively on three consecutive days. How many hours does she study daily on an average? ‘
Answer:
The average study time of Sita = \(\frac{\text { Total number of study hours }}{\text { Number of days for which she studied }}\)
= \(\frac{4+5+3}{3}=\frac{12}{3}\)
= 4 hours per day.
Thus, we can say that Sita studies for 4 hours daily on an average.
In general, mode is used to find the representative value of verbal data.
Example: To know the most popular game among the students of a class.
Find the mode of the data 5, 9, 6, 8, 6, 3, 6, 7, 2, 1, 17, 8 & 3.
Answer:
As 6 occurs more frequently than other observations, Mode = 6.
- Data having only one mode is called unimodal data.
- Data having two modes is called bimodal data.
- If no observation in the data is repeated then we say that the given data has no mode.
- If each observation in the data is repeated an equal number of times, then we say that the given data has no mode.
→ Median: In some situations, arithmetic mean is an appropriate measure of central tendency whereas in some other situations, mode is the appropriate measure of central tendency. Let us now look into the situations where median is appropriate measure of central tendency.
The median is the middle score for a given data that has been arranged in order of magnitude i.e. either in ascending order or in descending order. The median is less affected by maximum and minimum values of the data.
Let us consider the data below:

We first need to rearrange that data into order of magnitude (smallest first):
![]()
Our median mark is the middle mark – in this case, 56 (highlighted in bold). It is the middle mark because there are 5 scores before it and 5 scores after it.
If the number of observations is even then we simply have to take the middle twro scores and average the result.
Now look at the example below:

We again rearrange that data into order of magnitude (smallest first):

Only now we have to take the 5th and 6th score in our data set and average them to get a median of 55.5.
If there are n-observations in the given data, then
Median = \(\left(\frac{n+1}{2}\right)^{t h}\) observation, if n is odd
= average of \(\left(\frac{\mathrm{n}}{2}\right)\) and \(\left(\frac{\mathrm{n}}{2}+1\right)\) observations.
![]()
→ The 3 most common measures of central, tendency are the mean, median and mode. The mode is the most frequent value. The median is the middle number in an ordered data set. The mean is the sum of all values divided by the total number of values.
| Measure of Central Tendency | Useful information |
| Mean | When data set has no extreme |
| Median | When the data set has extreme values and there are no big gaps in the middle of the data |
| Mode | When the data has many identical values and for quick calculation |
→ Visual representation of the data: Data represented in the form of pictures, graphs or charts is visual data.
→ Bar graphs: Representation of numerical data by using bars of uniform width is called “Bar. Graph”.
In bar graphs the width of all bars or rectangles is equal and the height of each bar is proportional to the data that it represents.
Example : Bar graph showing the dates of births of a class during the months of a year.
→ Double bar graph :
- A double bar graph is used to display two sets of data on the same graph.
- From a double bar graph we can compare the two groups of observations in a single look.
Example: A double bar graph showing the number of boys and girls in a primary school.
→ Pie charts: A circle is divided into sectors to represent the given data is called a pie diagram or pie chart.
Or
Pie chart is the visual representation of the numerical data by sectors of a circle such that angle of each sector (area of sector) is proportional to the value of data that it represents.
Example :
Pie charts showing
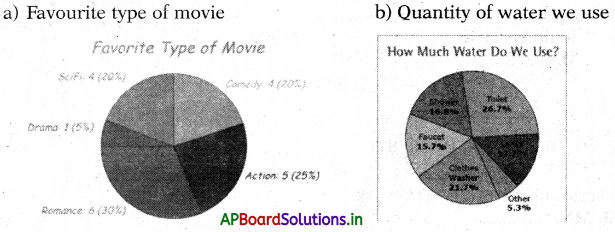
Angle of sector = \(\frac{\text { Value of the item }}{\text { Sum of values of all item }}\) × 360
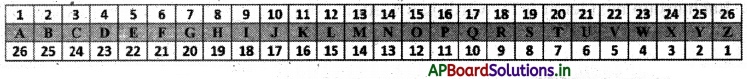
→ Letter Series :
Letter series is a logical arrangement of English alphabetical letters arranged in a specific pattern. In this series of letters, groups of letters, combination of letters and numbers are given. Each letter or group is called term. The terms of a series are arranged in a particular order or pattern. We have to identify the pattern and find the missing term (next term) from the alternatives, which will satisfy the pattern. Assigning numbers to the alphabets is very useful to practice letter series.
Example 1.
B, D, F, H, ________
(1)1
(2) K
(3) J
Answer:
(3) J
Explanation:
![]()
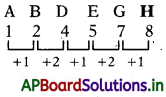
Example 2.
A, B, D, E, G, ________
(1) H
(2) I
(3) K
Answer:
(1) H
Explanation:
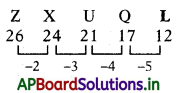
Example 3.
Z,X, U, Q, ________
(1) M
(2) K
(3) N
(4) L
Answer:
(4) L
Explanation:
Example 4.
QPO, NML, KJI, ________, EDC
(1) KL
(2) GHI
(3) CAB
(4) HGF
Answer:
(4) HGF
Explanation:
This series consists of letters in a reverse alphabetical order.
So, answer should be ‘HGF’.
Example 5.
AB, DE, HI, MN, ________
(1) TV
(2) TU
(3) ST
(4) RS
Answer:
(3) ST
Explanation:
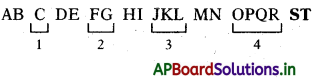
So, in the series next word is ‘ST’.
Example 6.
AB, EF, IJ, MN, ________
(1) QR
(2) OP
(3) XY
(4) PQ
Answer:
(1) QR
Explanation:
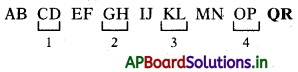
So, in the series next word is ‘QR.
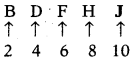
Example 7.
B2, D4, F6, H8, J10, ________
(1) L12
(2) K11
(3) N14
(4) M13
Answer:
(1) L12
Explanation:
Alternate letters with their assigned numbers. So, answer is L12.
![]()
Example 8.
AFK, BGL, CHM, DIN, ________
(1) GJO
(2) FIO
(3) EJO
(4) GJN
Answer:
(3) EJO
Explanation:
Each group next letter is forwarding 5th letter.
So, answer is ‘EJO’.